|
|
Click a column in the screen sample below for more information about that column (you will be taken to the Field Descriptions/Glossary section). |
Optionally, you can view the statistics for all Texas districts for a particular school year. To do so:
At the top of the screen, select the school year for which you want to view statistics.
From the option menu at the top of the screen, select the "Overall Statistics" option.
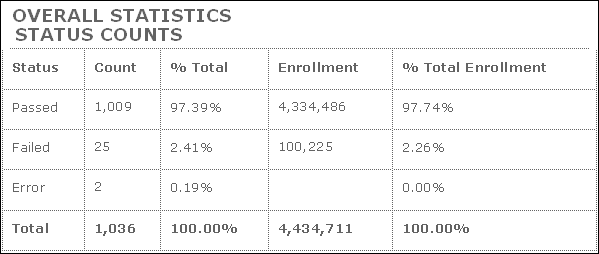
The first section of the statistics screen shows, for the specified school year, the number of districts that received a passing status, the number that received a failing status, and the number whose status has not yet been determined. This section also shows these numbers as a percentage of the total number of districts in Texas, and shows the number of students enrolled in each type of district (Passed, Failed, or Error/undetermined). Finally, this section shows the percentage of all students in Texas who are enrolled in each type of district. (If the number of districts for a particular status is zero, that rating is not shown in the table.)
|

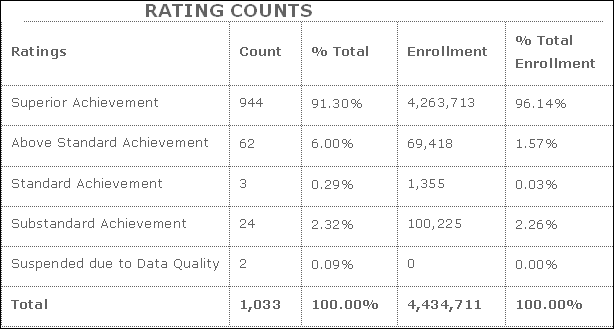
The second section of the statistics screen shows, for each of the five main ratings, the number of districts that received each rating, the percentage (of the total) of districts that received each rating, the number of students enrolled in districts which earned each rating type, and the percentage (of the total) of students enrolled in each district type. (Districts with a status of "Error" and a rating of "Undetermined" are not included in this section. Also, if the number of districts for a particular rating is zero, that rating is not shown in the table.)
|

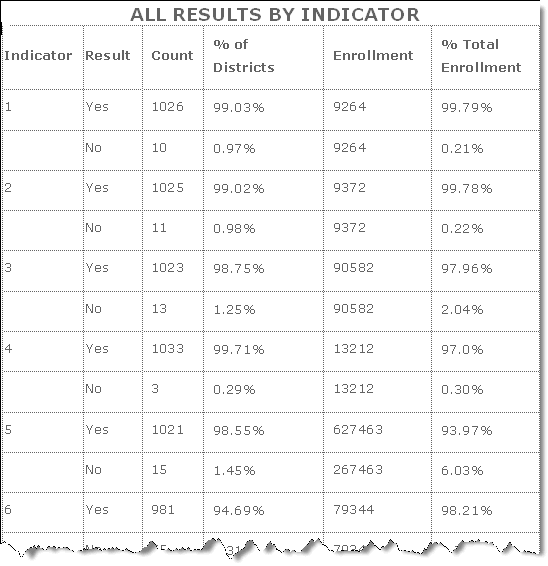
The third section of the statistics screen shows statistics for each indicator that was used in the calculation of the ratings and statuses. The table shows the number of districts receiving each of the categories of points by indicator.

This section of the statistics screen shows statistics for each indicator that was used in the calculation of the ratings and statuses. The table shows total counts for all indicators.
