![]()
State Level Read Only users cannot access participant-level data in any report, only aggregated data.
Jump to Generating_a_Report
See also Reports
Most reports are organized by local project, school year, and report period. Some feature a cumulative annual report. When the year is designated, the report is for that school year. Reports are designed as tools for program management and information for local programs. A summary of reports available to local programs is below.
After following the link sequence in the right column, select the desired report options such as Year, Quarter, and Local Project (if you have access to more than one). Leave Local Project on All (when it appears in the drop-down list) to get a statewide report.
|
|
State Level Read Only users cannot access participant-level data in any report, only aggregated data. |
|
Group / Name |
Description |
Selection Options |
Who Has Access |
|---|---|---|---|
|
Family Reports |
|
|
|
|
Active Family Home Visits |
Number of home visits and number of active families |
Local Project by program year, quarter or year-to-date (All) |
Admin, Co-ordinator, Key Entry, State Level Read Only |
|
Family Information by Family |
Family service and performance information, with detail to family name level |
Local Project by program year, quarter or year-to-date (All), and by ethnicity |
Admin, Co-ordinator, Key Entry, TEA Read Only |
|
Family Information |
Number of families projected, served, recruited, etc. |
Local Project by program year, quarter or year-to-date (All), and by ethnicity |
Admin, State Level Read Only |
From the Reports menu, select the report category, and then select the page or submenu that lists the type of report you want to generate.
Select desired options, such as School Year, School Quarter, or Ethnicity.
|
|
On some reports for some years the School Quarter drop-down list is disabled. Such reports provide only annual data. |
Click Submit. For most reports, the system displays the report with a toolbar at the top that provides options for paging through, searching, printing, and exporting the report. (A few reports appear as a simple web page, with no toolbar.)
After you generate a report that displays the Crystal Reports toolbar, see the diagram below for how to use the toolbar to navigate through the report.

|
|
The toolbar's Search function assumes that you are looking for whole words. You can perform searches for partial words in the current search result page by using your browser's Find feature (usually on the Edit menu). |
Multi-page reports feature a numbering system that assists in navigating the report. When you print or export a multi-page report, the system prompts you to specify pages.
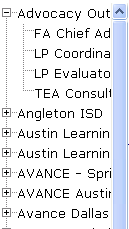
In some cases, a tree menu at the left features links to local project information. Click a link to navigate quickly to the corresponding information, or use the toolbar options to page through the report. Branches with an expand button (![]() ) contain sub-branches.
) contain sub-branches.

Some reports contain data elements that allow you to drill down into more detailed data, called sub-reports. Click a link to display the sub-report. To return to the main report, select the main report from the selector in the toolbar.
|
Clicking the Number of Families Departed link...:
...displays the details of the 8 families summarized:
|
|
When you perform a text search, if the text is found, it appears highlighted on the first page and location where it is found. Only the first occurrence of the search term per page is highlighted. If you click the Search icon (![]() ) again, the search begins again after the current page. To search within a page, use the Find function of your browser. This is often accessible by selecting Ctrl+F on the keyboard, or through the Edit menu.
) again, the search begins again after the current page. To search within a page, use the Find function of your browser. This is often accessible by selecting Ctrl+F on the keyboard, or through the Edit menu.
Information associated with any given record can run onto the next page, regardless of how you navigated to the first portion of the record.
|
TEA Consultant record starts at bottom of page 1...:
...and continues at top of page 2, with no heading:
|
|
See also Reports